Creating better business outcomes and competitive advantages for you is our mission. See our numbers below to understand how our operational excellence can have a significant impact on your business. Also, consider using these numbers as a benchmark to evaluate any vendor's performance.
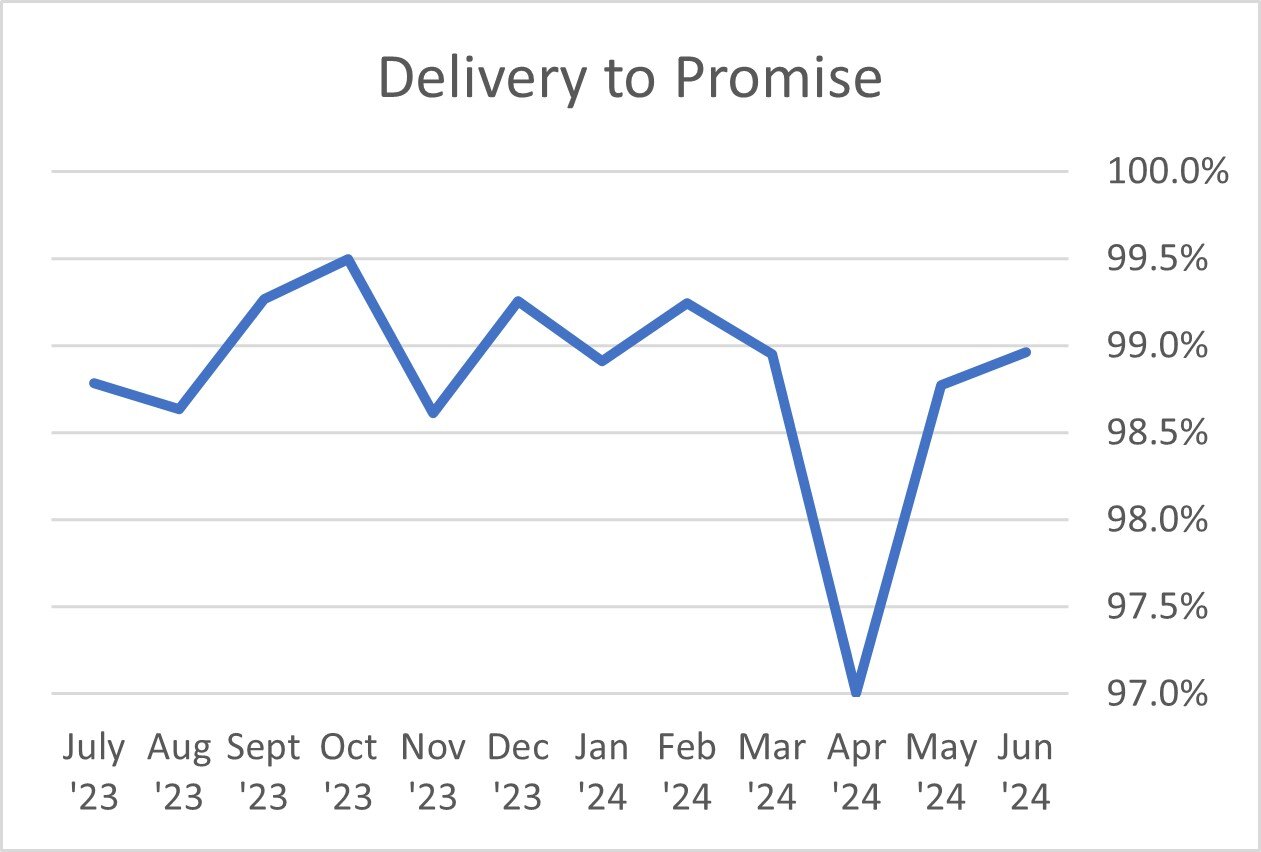
Delivery to Promise
This graph shows you the percentage of deliveries we make to the customer on time, according to the date we promise shipment to the customer.
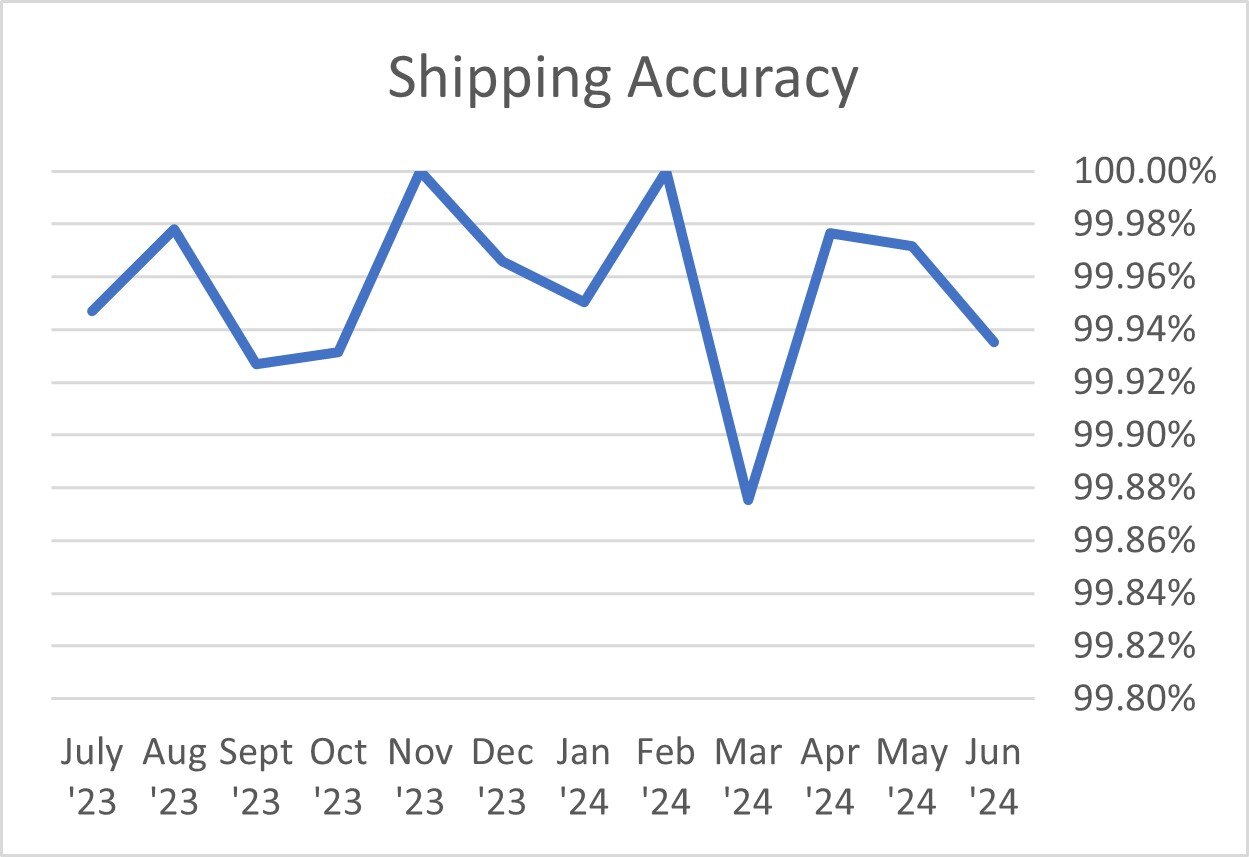
Shipping Accuracy
Our warehouse ships thousands of packages to customers every month. This chart displays the amount of total line items shipped accurately.
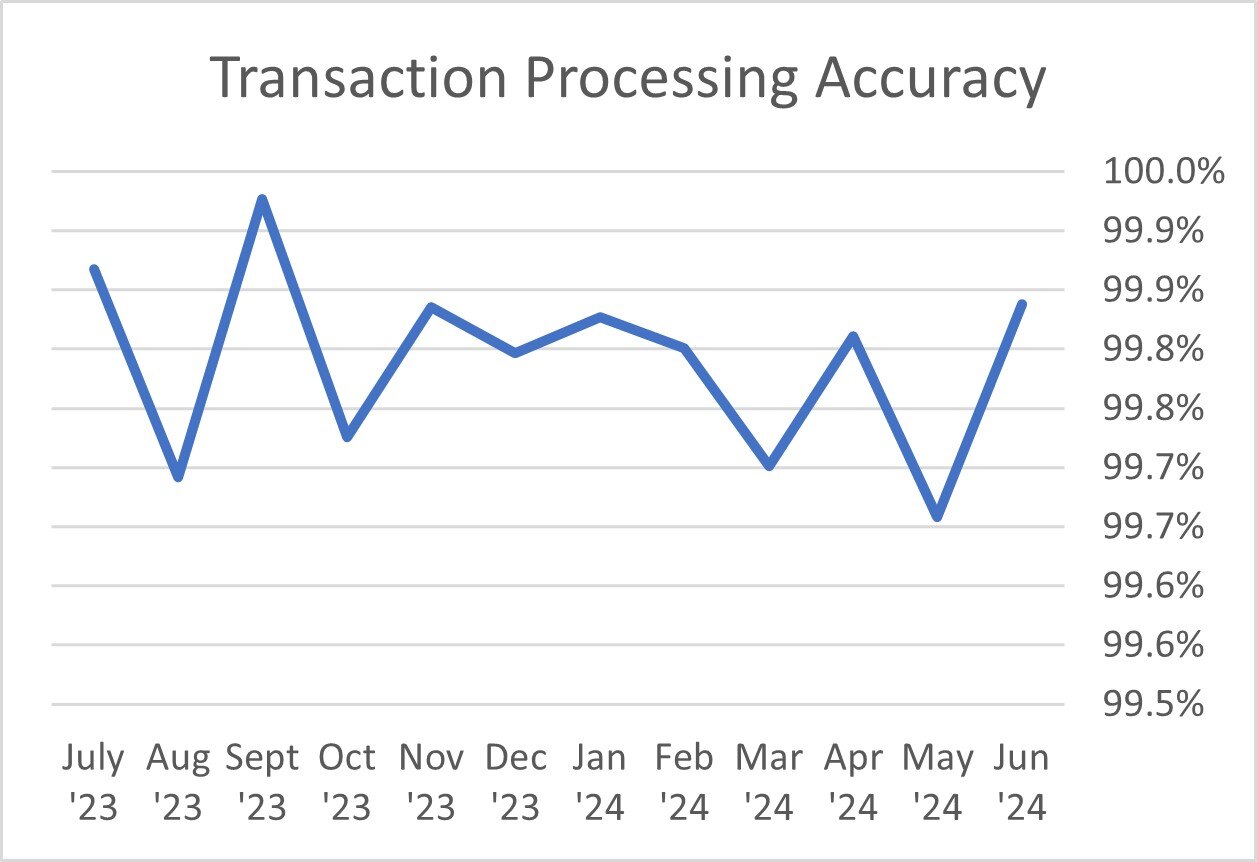
Transaction Processing Accuracy
This information shows the number of line items entered correctly.
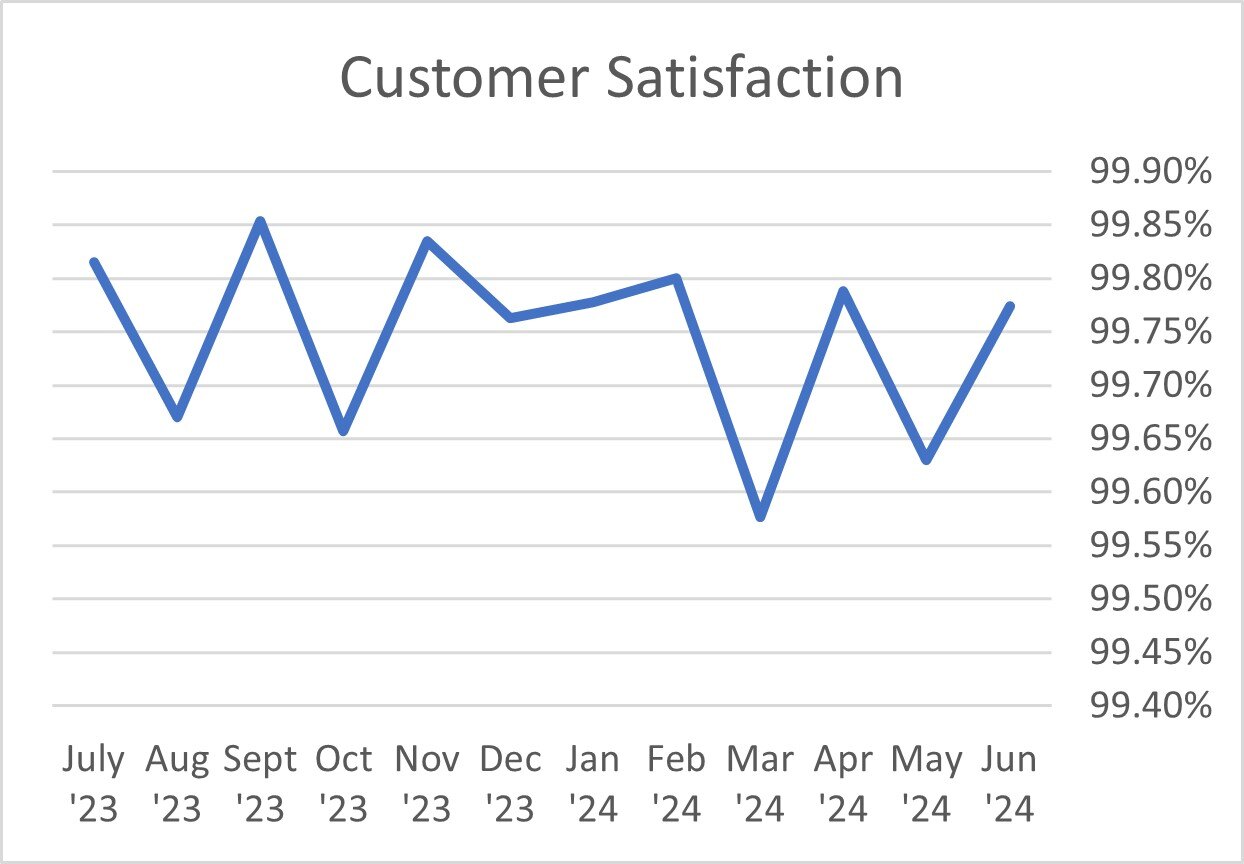
Overall Customer Satisfaction
99.51% satisfaction percentage through the first three months of 2023.
This chart shows how few complaints we get overall, relative to the total number of line items we ship.